In this article, we ask the question ‘What is a metric in Google Analytics’? We will take a deeper look at what it is and how it can help us organize and analyze our traffic data better.
What is “Metric” in Google Analytics?
Metrics are represented in numbers such as values, percentages, currency and time. In a Google Analytics report, metrics are quantitative measurements of data and give an indication of how your website is performing with respect to a specific dimension or as an overall value.
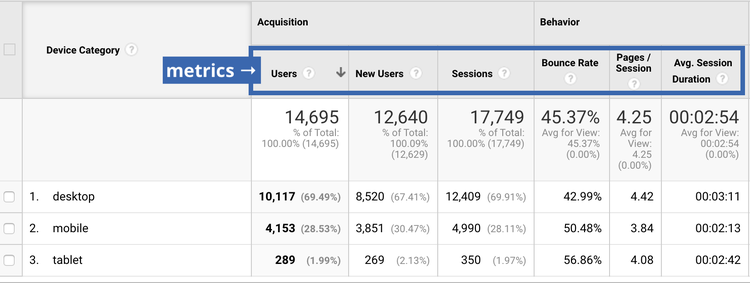
In the image below, we see an example of how metrics are represented in Google Analytics. You can see that for the device category (desktop, mobile or tablet) dimension, we have several metrics. Some examples include the total number of users, total new users, total sessions, the bounce rate (the total number of sessions that triggered only a single page view) and more.
Types of Metrics
Let’s analyze some Google Analytics metrics and understand what they represent. There are 3 types of metric categories:
Acquisition metrics
These are based on how the users found us and who the users are.
- Sessions – Google Analytics records the total time a user spends on your website. This session is stopped when the user is inactive for more than 30 minutes. It also keeps track of all user interactivity within a time span.
- Pageviews – Indicates the total number of pages views
- Users – Google Analytics metrics which shows the number of users in a website during a defined time period.
- Goal completions: A google analytics metric that specifies the number of goals which have been completed. This value is dependent on the dimension.
- Ad impressions – Ad impressions signify the number of engagements in an advertisement.
- Clicks – This metric helps you understand where users click the most. If you received 60 clicks in total, but your click share is 60%, it means that 40% of those clicks could have been used if you improved your campaign.
- New Users – the number of first-time users in a specific time period.
Behaviour metrics
This is based on the user’s behaviour once they visit our website or webpage.
- Bounce rate – The percentage of all single-page sessions that did not record any engagements. For instance, if a user landed on your page and did not click any of the links or navigate further.
- Exit rate – The ratio of the number of exits to the number of page views for a particular page.
- Pages per Session – The average number of page views during an individual session.
- Session duration – The average duration of a session.
Conversion Metrics
These are probably the most important metrics because it is concerned with how many users actually made a purchase and how much money we generated from this conversion.
- E-commerce Conversation Rate – This value signifies the percentage of the session that consisted of an e-commerce transaction.
- Transactions – The total amount of purchase transactions completed.
- Revenue – The return of revenue from our transactions.
Why are metrics helpful?
Metrics are very useful to help you analyze better the overall performance of your website and identify which pages are doing well and those which are not.
Google Analytics metrics can help you map out your website and identify which pages are being navigated by users and understand where these users are coming from. For example, are users clicking on backlinks from affiliation sites, from social media or from search engine result pages? It’s also a good way to determine what type of users frequent your site the most. For instance, desktop versus mobile users.
They are also good to identify priorities and determine their impact on your business. Metrics help you find which pages have the biggest potential for your business’s goals. In essence, metrics allow you to optimize your website based on real values rather than trial and error.
How are metrics calculated?
So now that we have an understanding of the different types of metrics and why they are helpful, let’s take a look at how they are calculated:
Overview totals
In this case, a metric is displayed as a summary statistics of your whole site. Examples of these are the bounce rate and pageviews as we saw above.
With Reporting dimensions
The metric value is quantified with respect to a selected dimension. A dimension is an attribute to your data. For example, a metric is a session but it’s calculated based on a dimension, such as City, for example, “London” or “Tokyo”, So in this case, the metric session indicates the total number of sessions based on those cities.
An example of metric calculations
A good example that Google uses to help explain the different metric calculations is shown below:
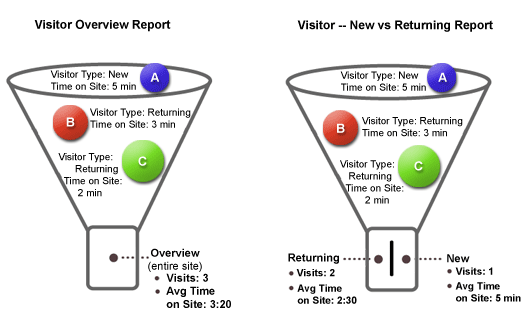
In the Visitor Overview report example, the calculations for the time period on the site are calculated using the time between a user’s initiation and exit of a session with the total of each session duration as an average across 3 sessions. This is done by recording the timestamps at a request level.
On the other hand, New Vs Returning report is not an average for all sessions. Instead, it uses a User Type dimension. It compares the Time on Site metrics with the User type dimension to determine which of those users are new and which are returning. This type of metric helps to understand the behaviour of users that is not provided in the overview report. In this example, we can clearly understand that new users take longer than returning users.
Final thoughts and recommendations
Google Analytics metrics gives us the possibility to understand better the behaviour of users when visiting and interacting with our pages, which pages convert better and how we can improve. Without metrics, we have no way of knowing how our website is performing.
We recommend you create an account on Google Analytics and start discovering the different metrics you can use for your website.

Veteran content writer with focus on Technology and SEO.